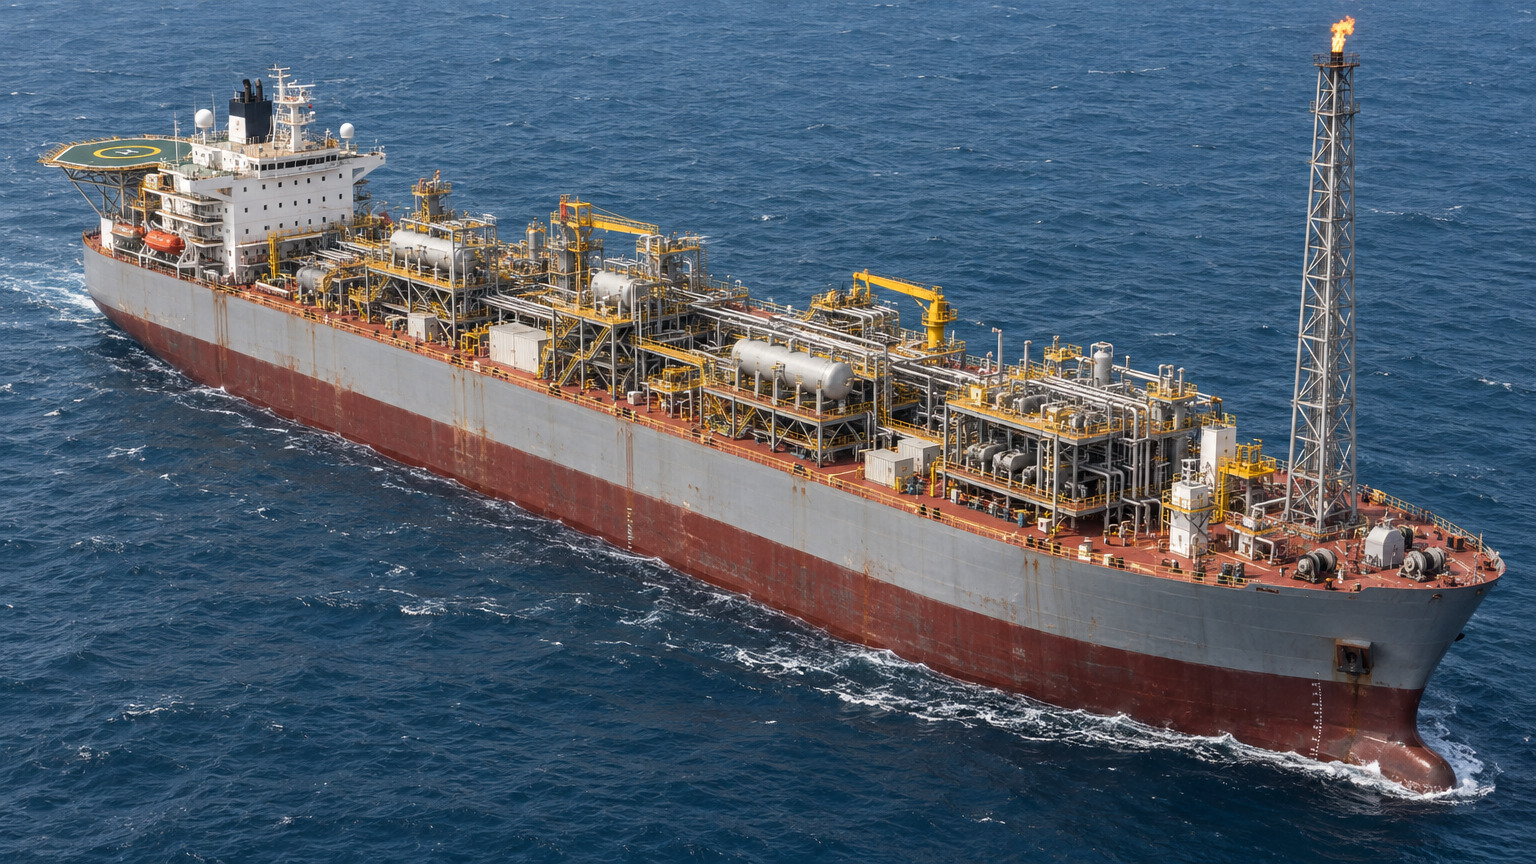
From Laser Scan to Digital Twin: Creating a Smarter Integrity View of an FPSO
10 minute read · HPG Engineering
An FPSO generates enormous volumes of information throughout its operating life — from inspection findings, structural assessments and maintenance actions to tank levels, production rates, process pressures, equipment status and real-time sensor data.
The challenge is rarely that the information does not exist. The challenge is that it often sits across different systems and is viewed independently.
Inspection records may be held in an integrity-management system, structural analyses in engineering software, maintenance actions in SAP or Maximo, while operational information such as oil volumes, tank levels, pressures, temperatures and production rates resides within process control, historian or production systems.
A digital twin can bring these different information sources into a common 3D environment, allowing users to understand not only what an asset is and where it is, but also its current condition, operational status, risk and relationship with surrounding systems.
It Starts with Reality Capture
The process can begin with laser scanning and reality capture.
High-resolution laser scanners capture the physical FPSO and create a detailed point cloud representing the asset as it actually exists.
This is particularly valuable on ageing assets, where years of modification may mean that original drawings or legacy 3D models no longer fully reflect the current installation.
The registered point cloud can then be used to develop or validate an as-is 3D model covering areas such as process modules, piping, hull structure, cargo and ballast tanks, cranes, utilities and major equipment.
But the 3D model is only the starting point.
From 3D Model to Intelligent Asset Model
The next step is to assign important equipment and structural components unique asset identifiers.
These objects can then be linked to existing systems and datasets.
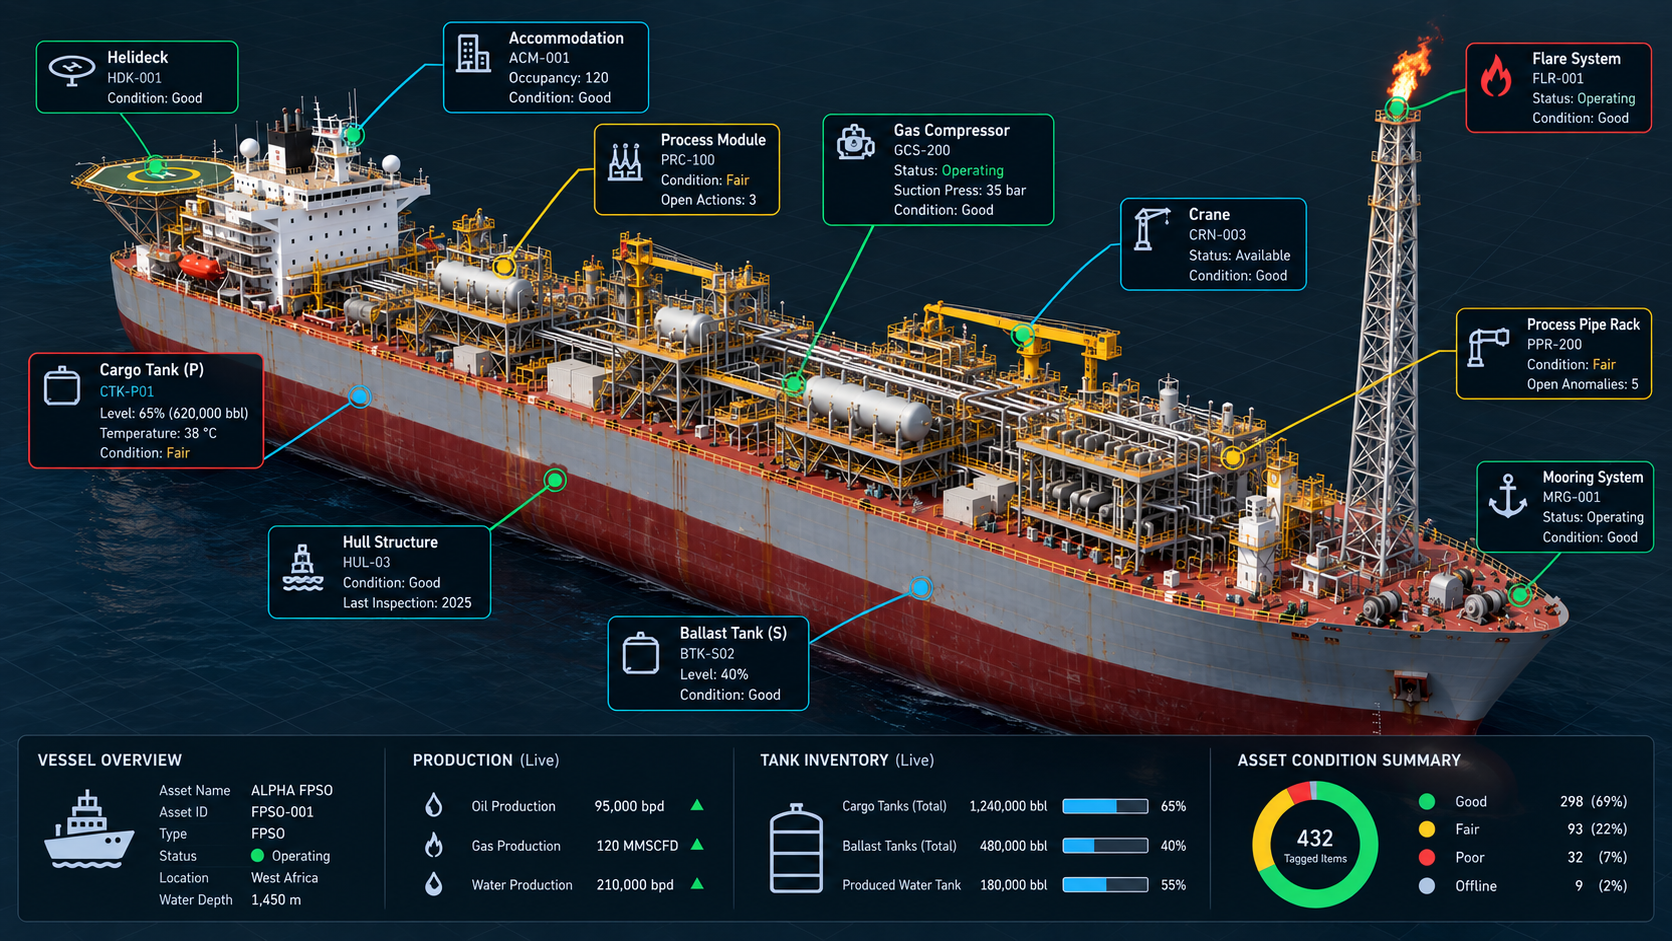
For example, selecting a compressor within the model could provide access to its: equipment tag, operating status, process conditions, inspection history, condition status, outstanding anomalies, maintenance history and SAP work orders.
A structural member could similarly be linked to: inspection findings, corrosion condition, thickness measurements, structural utilisation, fatigue information and integrity status.
A cargo tank could display: current tank level, estimated inventory, temperature, inspection history, coating condition, structural findings, open anomalies and next inspection due date.
The model therefore becomes a visual interface into the wider operational and asset integrity environment.
Bringing Together Operations, Condition and Risk
A mature digital twin can combine three different views of the same physical asset.
Operational state — What is happening now?
This may include tank inventory, production rates, pressure, temperature, flow, equipment status and sensor data.
Integrity condition — What condition is the asset in?
This may include corrosion, inspection findings, remaining wall thickness, fatigue, structural utilisation, coating condition and anomalies.
Risk and action — What does it mean and what needs to happen?
This may include RBI risk, criticality, engineering assessments, inspection requirements and SAP or Maximo maintenance actions.
Bringing these together creates a much richer understanding of the asset than any single database or dashboard can provide.
Making Risk Visible
One of the strongest benefits of a 3D digital environment is spatial risk visibility.
Traditional RBI or integrity-management systems may tell an engineer that a number of items are classified as high risk.
A digital twin can show where those items actually are on the FPSO.
Assets could be visually filtered by condition or risk:
Green — Acceptable
Amber — Monitoring or further assessment required
Red — Intervention required
This can reveal patterns that may be difficult to recognise in a spreadsheet or conventional risk register.
A concentration of corrosion findings within one process module may indicate a wider degradation issue.
Several degraded supports beneath the same piping system may suggest a common integrity concern.
A corroded item above a frequently occupied area may also present a dropped-object risk that is more significant than the defect alone suggests.
The 3D environment therefore provides risk context, not simply risk ranking.
Understanding How Risks Interact
FPSO risks rarely exist in isolation.
Structural degradation may affect piping support. Piping failure may expose nearby equipment. A hydrocarbon release may expose structural members to fire. Crane operations may introduce dropped-object exposure over safety-critical equipment.
A digital twin can help engineers examine these relationships spatially by overlaying information such as: structural integrity risk; inspection findings; corrosion condition; process safety information; dropped-object exposure; critical equipment; escape and evacuation routes; and outstanding maintenance actions.
This can provide a clearer understanding of how different risks interact across the asset.
Interactive Integrity Management
The real value comes when users can interact with the model.
An engineer selecting an item should be able to quickly answer: What is it? What is it doing now? What condition is it in? When was it last inspected? What is its current risk? Are there open anomalies? Has it been assessed? Is there an outstanding maintenance action?
For example, selecting a structural member may reveal:
Member B-204 — Condition: Poor — Latest inspection: June 2026 — Degradation: General corrosion — Structural utilisation: 0.78 — RBI risk: High — Open anomaly: STR-0264 — SAP notification: 400327
The engineer moves from identifying the physical item to understanding its condition, risk and required action within seconds.
Key FPSO Use Cases
The same environment can support a wide range of engineering, operational and integrity activities.
For inspection planning, engineers can visualise access requirements, difficult locations, scaffolding needs and nearby hazards before mobilising offshore.
For corrosion management, inspection findings and thickness measurements can be displayed spatially to identify areas of recurring degradation.
For tank and hull integrity, condition data can be associated directly with compartments, structural elements and previous inspection findings.
For operations, tank levels, equipment status and process information can be viewed in their physical context.
For brownfield modifications, accurate as-is geometry can support clash detection, constructability reviews and modification planning.
For dropped-object management, engineers can consider not only the condition of an item but what lies beneath it and the potential consequence if it fails.
For maintenance planning, users can identify open work orders, outstanding corrective actions and maintenance backlog in relation to the physical asset.
Supporting Life Extension
Digital twins can become particularly valuable during FPSO life-extension programmes.
Life-extension assessments may identify hundreds of anomalies, inspection uncertainties, fatigue-sensitive areas and maintenance issues.
A digital integrity model can help operators identify and monitor the items that genuinely drive continued safe operation. These may include: fatigue-critical details; hull or tank degradation; topside structural deterioration; piping degradation; ageing equipment; overdue inspections; unresolved anomalies; maintenance backlog; and uncertainty in asset condition.
Users can therefore move from a high-level view of the FPSO down to the specific component or anomaly driving the risk.
Connecting Existing Systems
A digital twin should not replace the systems an operator already uses.
SAP or Maximo can remain the maintenance system of record. RBI platforms can remain responsible for risk management. Engineering tools such as SACS, SESAM or ANSYS can remain the analytical environment. Inspection databases can continue managing inspection information. Process historians and operational systems can continue supplying live or near-real-time production and equipment data.
The digital twin provides the common asset context connecting them.
A typical workflow may look like: Laser Scan → As-Is 3D Model → Asset Tagging → Operations / Inspection / RBI / Engineering / SAP Integration → Interactive Risk Visualisation → Engineering and Maintenance Action.
From Data to Decisions
The objective is not simply to create an impressive 3D model. It is to make asset condition, operational status and risk easier to understand, interrogate and act upon.
For HPG Engineering, we describe that journey simply as: SCAN → MODEL → TAG → CONNECT → ASSESS → VISUALISE → ACT → UPDATE.
The 3D model makes the asset visible. The connected data makes it intelligent. And the ability to understand operations, condition, risk and interaction in their physical context is what turns the model into a practical asset management tool.
See Digital Asset Integrity in Action
Explore how reality capture, digital engineering models and integrity data can support inspection planning, engineering assessment and intervention decisions.
Technical Paper - From Point Cloud to Engineering-Ready 3D Models
Explore the complete workflow from laser scanning and point-cloud registration to 3D model development, verification and integration with asset integrity information. Includes practical diagrams, quality checks and an illustrative brownfield engineering example.